Visual management is a key part of the daily management cycle on the shop floor. Standards on the shop floor define how we should be operating.
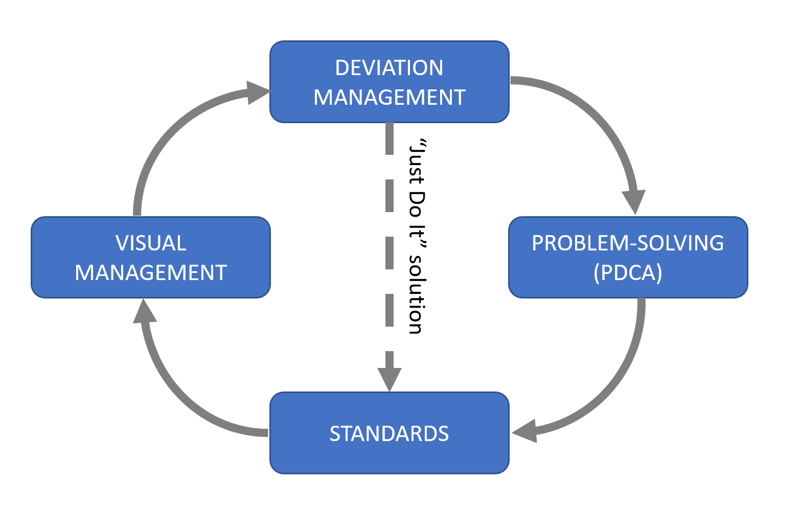
Visual management tells us immediately if (and where) we deviate from standards so we can react immediately to abnormalities, either through Just Do It (JDI) obvious solutions, or through structured problem-solving using a Plan-Do-Check-Act (PDCA) framework.
Visual management is anything that lets people immediately know if they are deviating from a standard.
Can be Visual: Normal? Abnormal? …or through any of our senses:
It could be the line with the most quality or performance issues, for example.
Don’t implement visual management everywhere at once! Remember that it is meant to produce action, and therefore consumes management and problem-solving resources.
Take the area’s motivation level into account. It’s better to start with a team who’s enthusiastic and energetic about improving things, than with a passive or negative team.
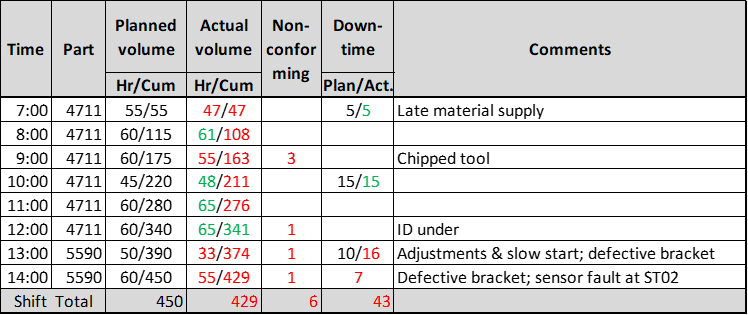
You will need the following data to run a HBH Board:
Each board has a cost, since it must be filled in and reviewed every hour. For short lines and production cells, place the board at the end, to capture the output of the line or cell. For processes that are scattered in multiple locations, consider instead placing the board at the bottleneck machine or where the biggest problems are. Then move the board elsewhere as the issues get resolved.
Be crystal clear about who fills in what on the board, and how the numbers are defined (e.g. does the production volume include defectives? Our answer is “no”).
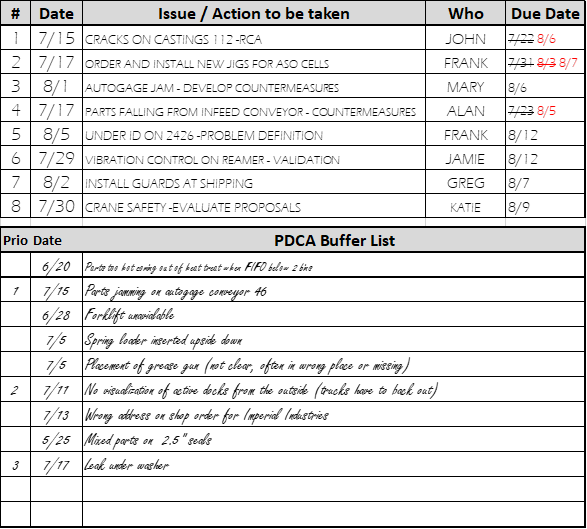
Alongside the HBH Board is a whiteboard or flipchart: the Action Board. The board is a way to put in writing the problems we are encountering, which should trigger some very concrete problem-solving.
Explain that this is aimed at doing something about the everyday obstacles they encounter.
It’s not aimed at individuals (we track the process, not the people).
In practice, the pressure is more on the managers than on the operators.
Consider using an auditory signal at the top of every hour for the first few weeks.
Team Lead or supervisor reviews every board in their area.
In some cases, what needs to be done is obvious – a JDI (Just Do It). In other cases, you need to talk with the appropriate person. Formulate a hypothesis about what happened and take action to confirm or invalidate it.
Write the hypothesis and action on the action board. You will track results and try to solve the problem here.
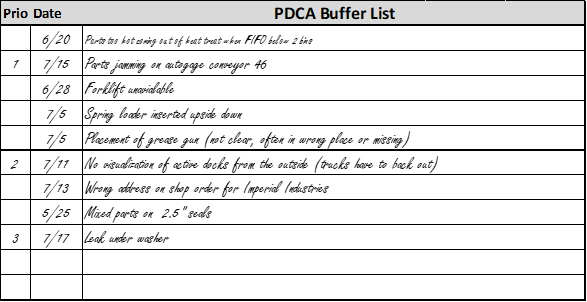
If the problem is too complex for rapid solving (i.e. can’t be solved in less than 2 hours), enter it in the PDCA Buffer List board. This board is located where the daily accountability meetings take place (see next point). The top three priorities in the list are regularly updated.
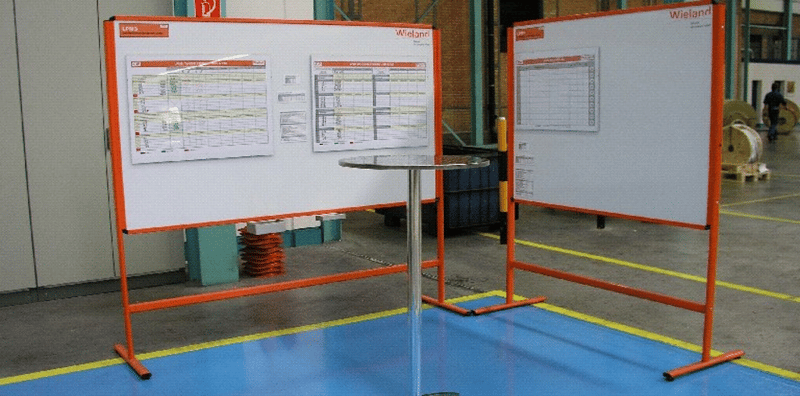
Every morning a Daily Accountability Meeting is held, using an Area board and Action/PDCA Board.
Stand-up meetings should be no more than 15 minutes long. The purpose is to manage PDCAs by tracking advancement, escalating issues, and launching new PDCAs.
The daily standup meeting participants should include:
The reason for the buffer list is to set a maximum number of active actions to avoid overloading the system. Move items from the buffer to the active board when an issue is resolved.
Items that cannot be resolved at the daily meeting (e.g., require a kaizen team or a project team) get escalated to the leadership team.
Continue adding visual management tools. Each one is going to make life easier! You can get creative, as the examples below illustrate.
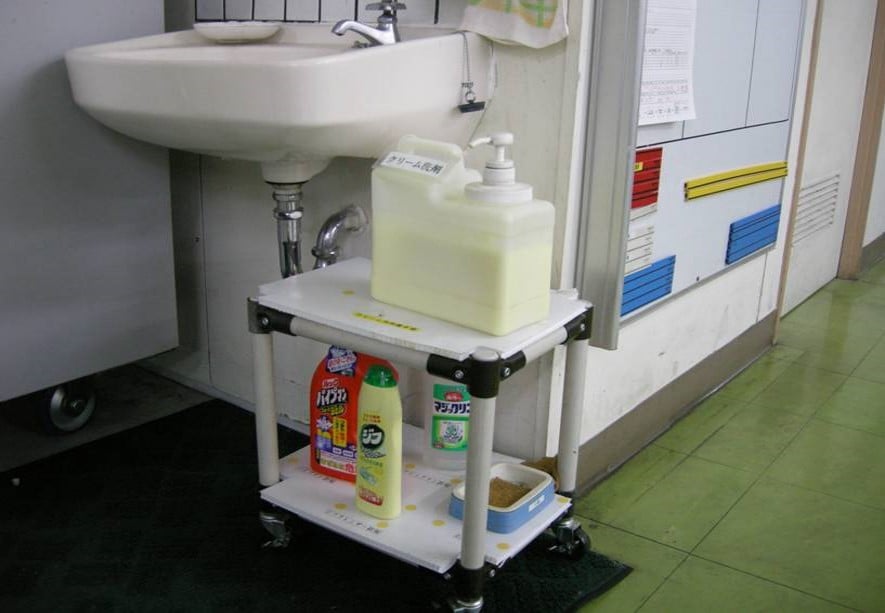
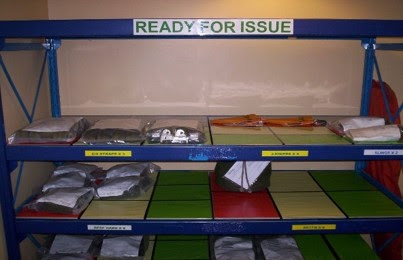
This example shows how 5S is a visual management tool that lets you know something is missing or doesn’t belong here:
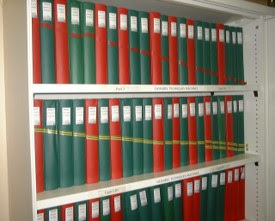
This simple hack makes it easy to see if a folder is missing or in the wrong place:
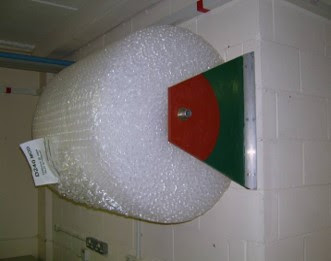
In this example, when you're down to the red zone, it's time to order a new roll:
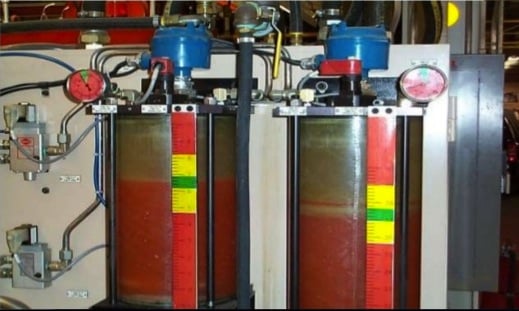
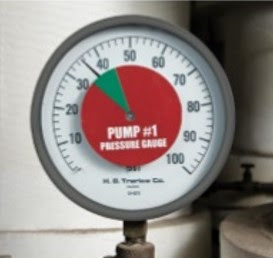
Here, you can see that something is wrong if the pressure indicator is outside the green zone:
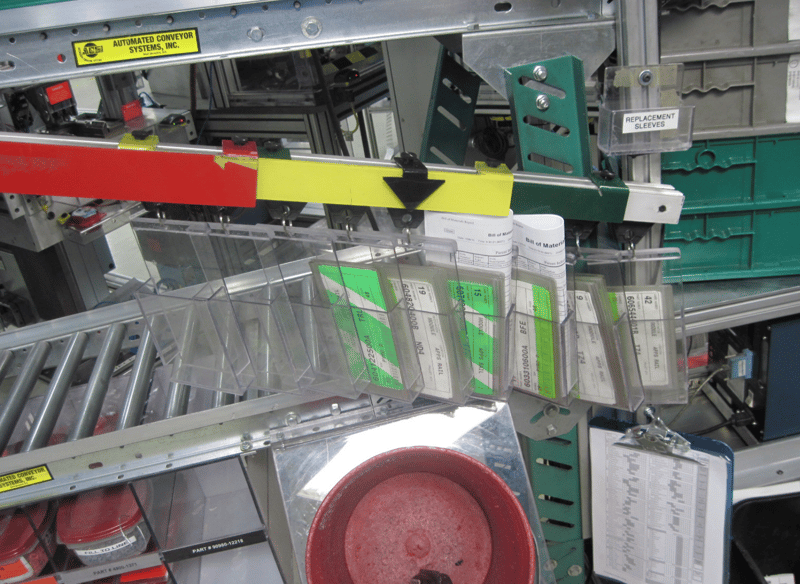
This "visual kanban" show the team what to produce next:
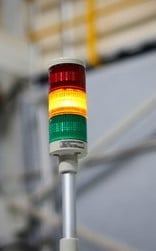
In this example, green is OK, yellow means you need to investigate, and red means stop: